|
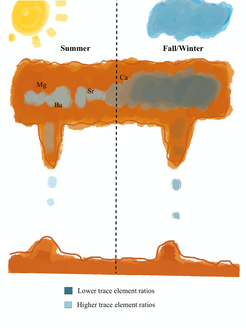
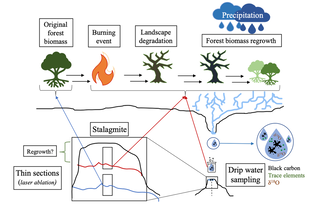
Reading scientific literature is a hard process to get used to and it is no different for undergraduate scientists. I found it was especially hard to keep students engaged with scientific literature this past spring when everything was shut down for the pandemic and students were working from home. To keep students engaged and to deepen student learning, I like to use something I call the “concept diagram.” There are many examples of concept diagrams in the literature (e.g. Treble et al., 2016; Wortham et al., 2017 (see publications page)). I am always pleased when I see them in the literature because it is a simple tool to illustrate complex processes. Students, however, can also learn to make concept diagrams for themselves when they are reading papers as a way to make sure they understand the processes. In this blog post, I advocate that you have students make a diagram, sketch, or flow chart (without data) of a process that a paper is trying to describe. In a simple form, this could be a flow chart of the methods the paper used. In a more complex form, this could be a diagram of a part of the discussion. Step 1: start simple! Have your students read a paper and highlight a discreet process that the authors of the paper are trying to explain (methods, or why the data is responding in time, etc.). I recommend that you, as the leader, start with a paper you know very well so that you can give feedback about what process the students highlighted. This first part could be homework or something students do to prepare for meeting with you. After the students have read the paper and have identified the process (and you approve) have the students explain to you or to a partner what process they chose, and why. Step 2: get creative! At this point, I bring out markers, pens, colored pencils, regular pencils and/or illustrating programs on the computer and ask students to begin illustrating the process they chose. Students often start with a flow chart as a go-to. This is fine. If students start with a flow chart, encourage them to color the boxes based on their importance to the process, or make symbols next to the boxes that would illustrate what the words in the box are saying. Really, at this step the students should be letting lose and drawing whatever comes to them about the process. Is the paper about the ocean? Then the students could start by drawing a water scene! Is the paper about AI? Then the students could start with an animated robot! The creativity aspect is what keeps students engaged with the paper. It may seem elementary or sophomoric, but everyone likes to be creative (unhindered creativity is something we should all be harnessing more in our lives). Also, the fact that I allowed students to be completely creative on the first round is what kept students engaged during the pandemic. During WFH, students that I interacted with were feeling cooped up, scared, and uninspired. When I told them that they could bring out watercolors, paints, or their favorite gel pens to class for the rest of the quarter, I saw a big shift in their engagement. Step 3: Reduce words! Some undergraduates will use so many words it’s like they rewrote the section on a new piece of paper. If this is happening, encourage students to replace action words with arrows and nouns with symbols that illustrate that noun. Reducing the words of the process is the start of editing the diagram to make it more clear, although you will likely add some words back in. Alternatively, some students won’t use any words (also difficult). Encourage these students to add in a few arrows or to create several diagrams (like storyboarding) that illustrate the process from the paper through time. Step 4: share to the group or you. In this step you can have students share their diagram to each other or to you. This is a good place for you to check for understanding and encourage students to pay attention to pieces they may be missing. I have found that when students are asked to explain their diagram to each other, they notice what pieces are not well illustrated or just not on there. Here are some examples of concept diagrams my students did this past spring. These diagrams illustrate how chemical signals are translated through cave settings and ultimately are archived in stalagmites. You might notice that students are using very few words and are utilizing visual signals to illustrate meaning (darker colors, arrows, skewing the labels).
Step 5: repeat. In the spring of this past year, I had the students in my group do something like this for every paper we read (1 per week) so that they would continue to engage actively with the material. I don’t normally do that many of them, but it seemed like a good time to keep students thinking creatively. The more students do this task, the more they will be able to explain complex processes in papers and the complex process they themselves may be researching.
0 Comments
|
AuthorI am a Ph.D. Candidate who actively tries to create an equitable and enriching experience for undergraduate researchers, I post weekly about the things I teach and my experiences with undergraduates. Archives
August 2021
Categories
All
|
 RSS Feed
